The Superadmin Dashboard is your starting point for the day! You can access it by clicking “Superadmin” on the top bar.
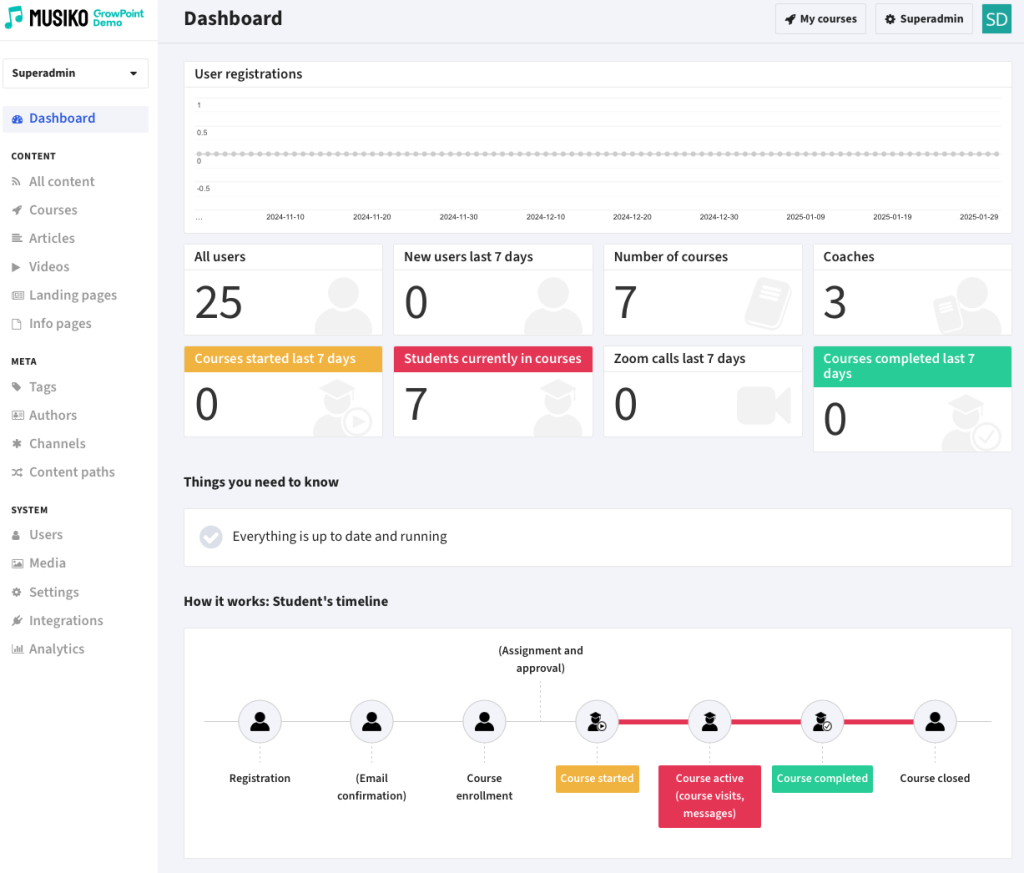
Superadmin panel dashboard
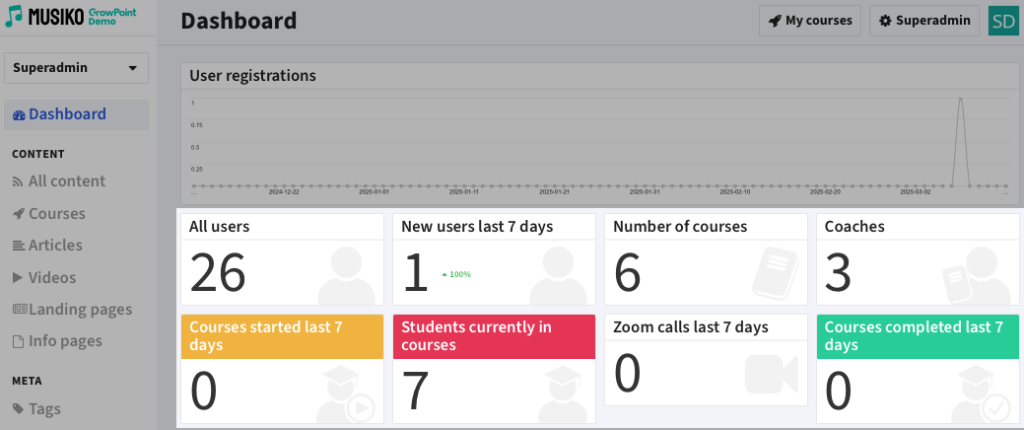
Graph displaying new daily user registrations for last 90 days. This allows administrators to quickly identify trends and respond accordingly.
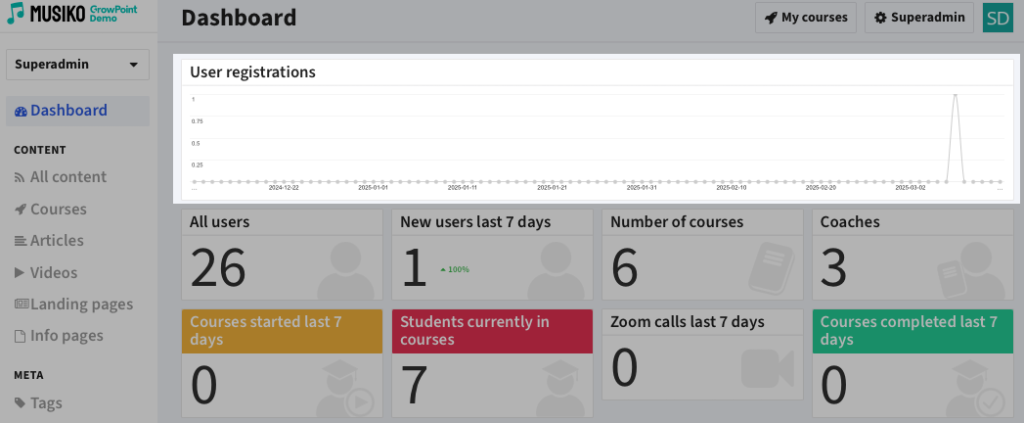
Daily user registrations chart
Current platform metrics
| All Users | Total number of registered students on the platform. |
| New Users (Last 7 Days) | Number of new student registrations in the past 7 days. |
| Number of Courses | Total number of available courses. |
| Coaches | Total number of active coaches. |
| Courses Started (Last 7 Days) | Number of courses initiated by students in the past 7 days. |
| Students Currently in Courses | Number of students actively participating in courses. |
| Zoom Calls (Last 7 Days) | Total number of Zoom calls made on the platform. |
| Courses Completed (Last 7 Days) | Number of courses completed in the past 7 days. |
A percentage indicator is displayed, showing the growth ratio compared to the previous week.
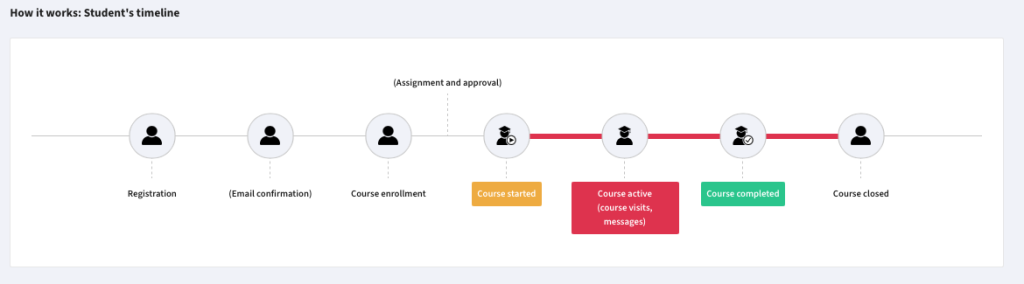
Student timeline graph
A graphical representation of the student’s journey through the platform.
Messages from the system to Superadministrator
A section for important messages and suggestions for the Superadmin. Messages can be dismissed, but they will reappear after three days until resolved.
This section informs the Superadmin about new features, improvements, and fixes. You can review a few previous versions here. For the full changelog, visit GrowPoint.io.
